


Maintenance Metrics That Actually Matter — What 5.5 Million Units of Data Is Telling Us
Average completion time in maintenance is a dangerous metric that's frequently misused. The industry claims 66% of work orders are completed within 24 hours, with an average of 3.88 days—but these figures mask the real story.
After analyzing data from 5.5 million units on HappyCo's platform, we found some misuse and misconceptions with this "beloved" benchmark. While averages look acceptable on paper, they often hide some bigger truths affecting resident satisfaction.
Welcome to the first installment of a new series where we take aim at the biggest myths in maintenance, and let the data do the talking.
During our recent webinar, our CEO Jindou Lee summed it up perfectly: "We all think we know a lot about the maintenance, operations and data side of things, but this one really got me thinking and challenged all the assumptions I had. And the data says otherwise."
Stop Letting Averages Hide Your Real Problems
Average time to complete — this number can hide a lot of pain. You can have 10 work orders done in a day. That's great, but if two of those drag out for weeks, your residents are going to notice. That's when trust can really start to fall.
As Jindou noted during our discussion, we've seen success stories like Anchor NW Property Group, one of our customers operating at 170 units per technician—pretty astounding when you consider the traditional benchmark was 100 units per tech. As he pointed out, "You know, the traditional one to 100 ratio was a really big thing, and we've been able to kind of help push that talk track for our customers."
Don't get trapped by believing averages tell the whole story. Focus on outliers that drag out for weeks—those are what residents remember.
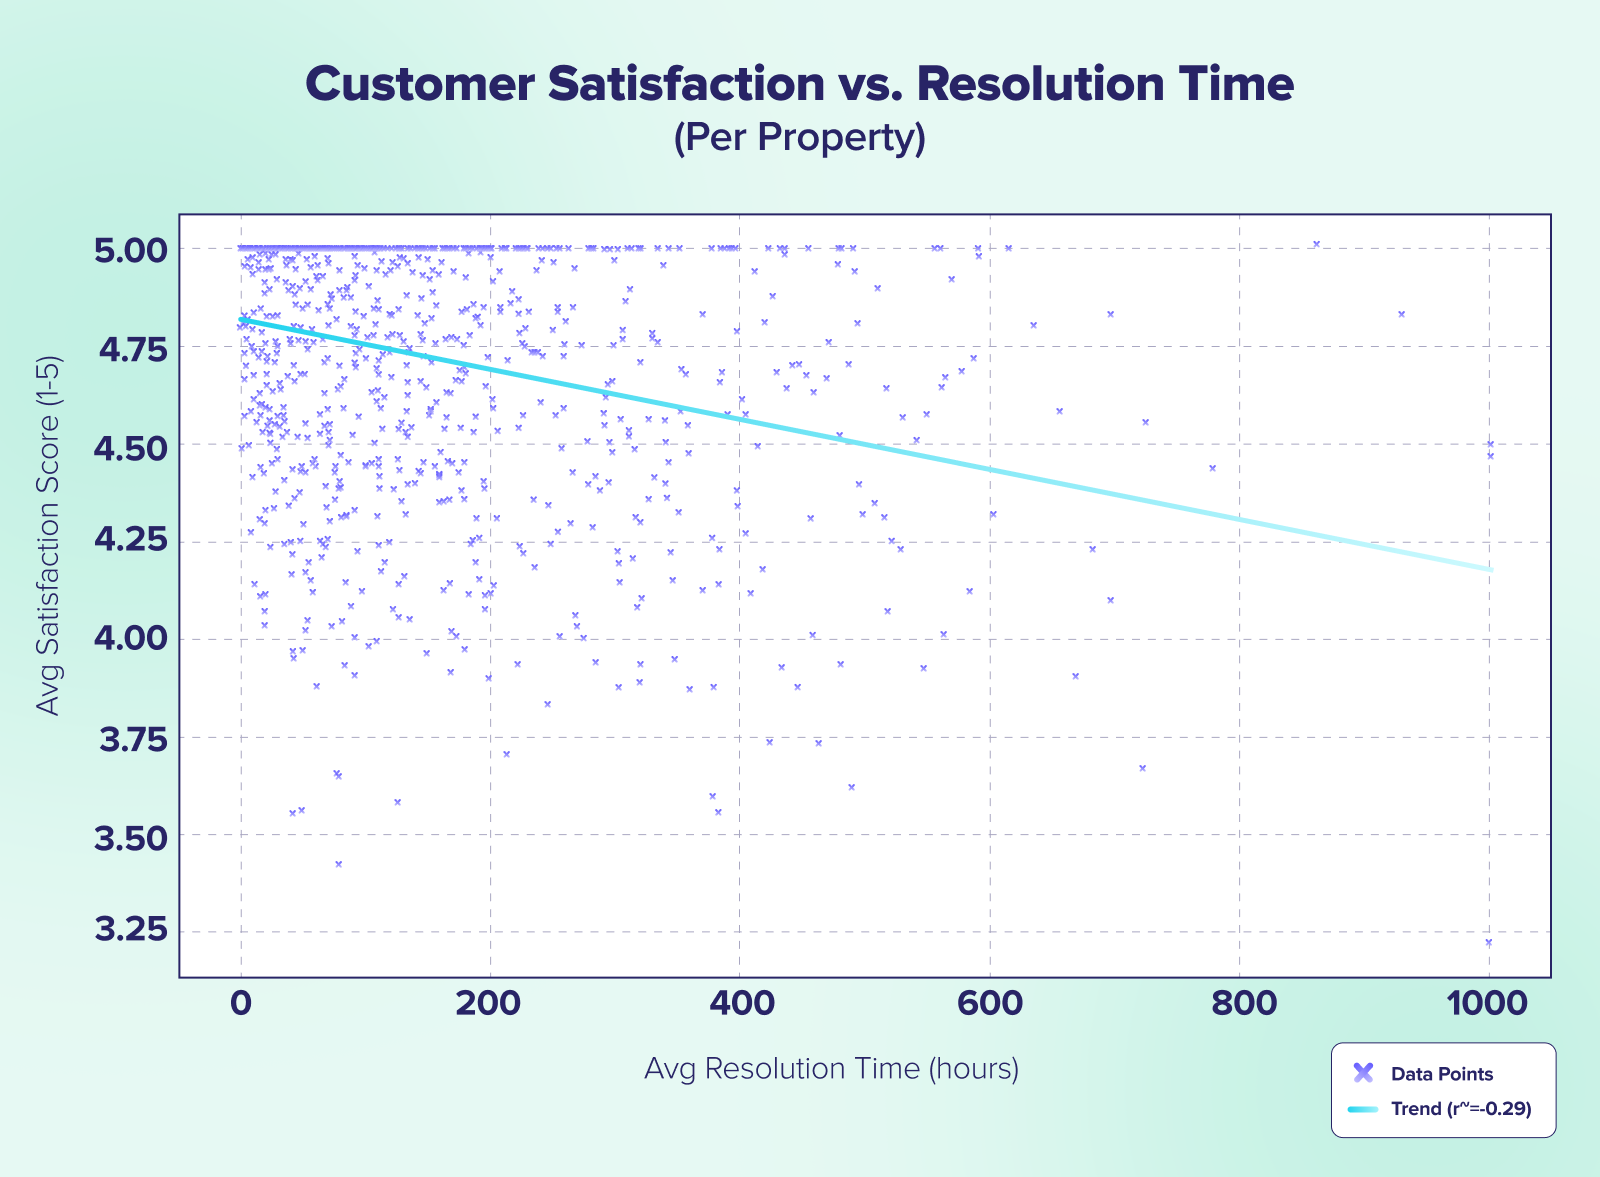
Interestingly, our data shows there is a correlation between resolution time and customer satisfaction, but that correlation is actually quite weak. This reinforces that fixating on averages alone misses the bigger picture of resident experience
Preventative Maintenance: The 25% Solution Nobody's Tracking
The most impactful thing a property can do to increase resolution time is invest in preventative maintenance. When companies utilize all of HappyCo's preventative maintenance features—inspections and inventory tracking—we see their average resolution time is 25% faster.
Properties doing regular inspections (4+ per unit per year) also saw 25% fewer repeat work orders. The strategy is clear: invest in preventative maintenance features, target 4+ inspections per unit per year minimum, and focus on catching those "big, hairy issues" before they become emergencies.
What Actually Drives Speed
Our data revealed what really impacts completion times:
- Work order management systems like HappyCo: 21% improvement
- HVAC monitoring: 18% improvement
- Smart sensors: 16% improvement
- Resident engagement tools: Measurable improvement through faster reporting and better coordination
The data tells us that the right tools drive the greatest improvement.
Why First-Time Resolution Beats Speed
Engagement tools make a difference because a) they report issues from residents to the property faster, and the faster an issue gets reported, the easier it's going to get resolved. And b) there's better coordination happening between the resident and the technician. In the resident's mind, the data might show that you're getting these work orders done quickly. But in the resident's mind, that issue is not resolved until it's fully resolved. Our recommendation:
- Implement tools that let residents see work order status and communicate directly with technicians.
- Enable technicians to notify residents when they're on their way.
- Focus on transparency—residents want to know where their work order is at and what the status is.
- Prioritize first-time resolution over quick fixes that create repeat visits.
What Our AI Model Revealed
We built an AI model to predict work order resolution times and analyzed what the model considered most important. Here's what actually predicts resolution time:
- Priority level - High priority or urgent work orders get done faster
- Category/issue type - This was intuitive, but surprising how much it varied
- Property type
What doesn't matter: property size, property location, or total number of work orders per month. The model didn't think any of those variables were useful in predicting resolution time.
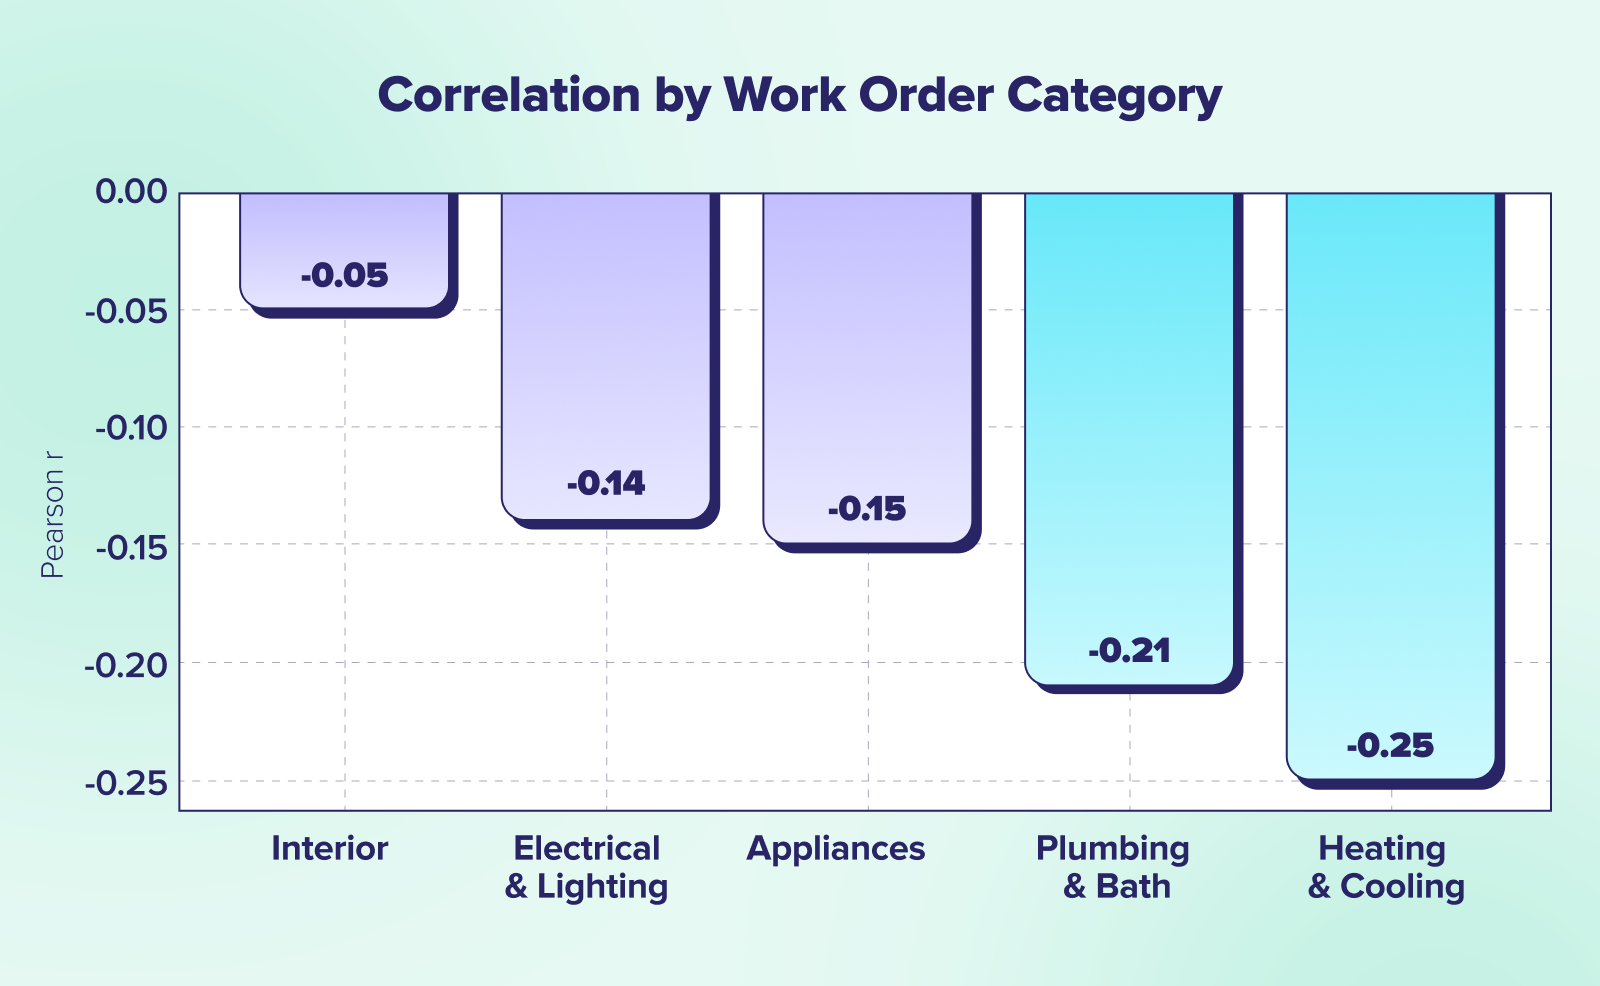
When we analyzed customer satisfaction versus resolution time, we discovered the correlation was very weak. There are plenty of work orders getting completed quickly that still score really low. But here's where speed actually matters: HVAC issues have a much stronger correlation to satisfaction—almost negative 25—compared to electrical/lighting issues that don't correlate much at all.
It does matter how fast we're resolving work order issues, but specifically it matters when we're looking at different categories.
Let Joy Give You Answers, Not Just Data
We want to empower all customers to access these data insights instantly. Ask Joy questions like "What are the top three ways to improve customer satisfaction at this property?" and get immediate answers that compare your property against your portfolio, showing you what better-performing properties are doing so you can replicate their success.
Use Joy to ask specific questions about your data instead of drowning in dashboards. Get property-specific recommendations based on your actual performance.

The Bottom Line
No one's going to write a glowing review just because a light bulb got changed really quickly, especially if other things aren't working right.
The data tells us to stop obsessing over one overarching number and start thinking about category-specific targets. Not all work orders are created equal, and treating them like they are leads to misallocated resources and frustrated residents.
What we want is to bring operational costs down and increase the unit to tech ratio, but we also want to see what sensible things we can do to reasonably drive that overall time to resolution down—without just throwing more bodies at the problem.
What's Coming Up Next
This is just the start of maintenance metrics, uncovered — where we’ll continue challenging industry assumptions with data-driven insights.
Our next chapter? How make-readies are really impacting your bottom line.
Sign up here for our newsletter to get notified

Trevor Riley is VP of Product at HappyCo with extensive experience in the real estate and property management industries. He began his career at Vivint, then climbed the ranks at Entrata for over a decade to become SVP of Product. After a stint as Head of Product at BiggerPockets, Trevor recently returned to multifamily as VP of Product for HappyCo. You'll most likely find him in a hot tub with a good book or exploring Utah's mountains with his wife and three boys.


